Sept. 24, 2017 — A look back at #HurricaneIrma.......
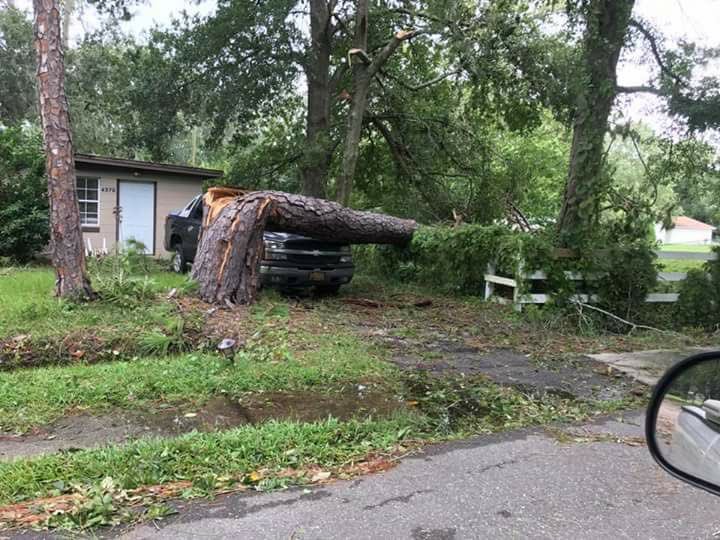
Photos: Must-see photos of Irma damage in Jacksonville area
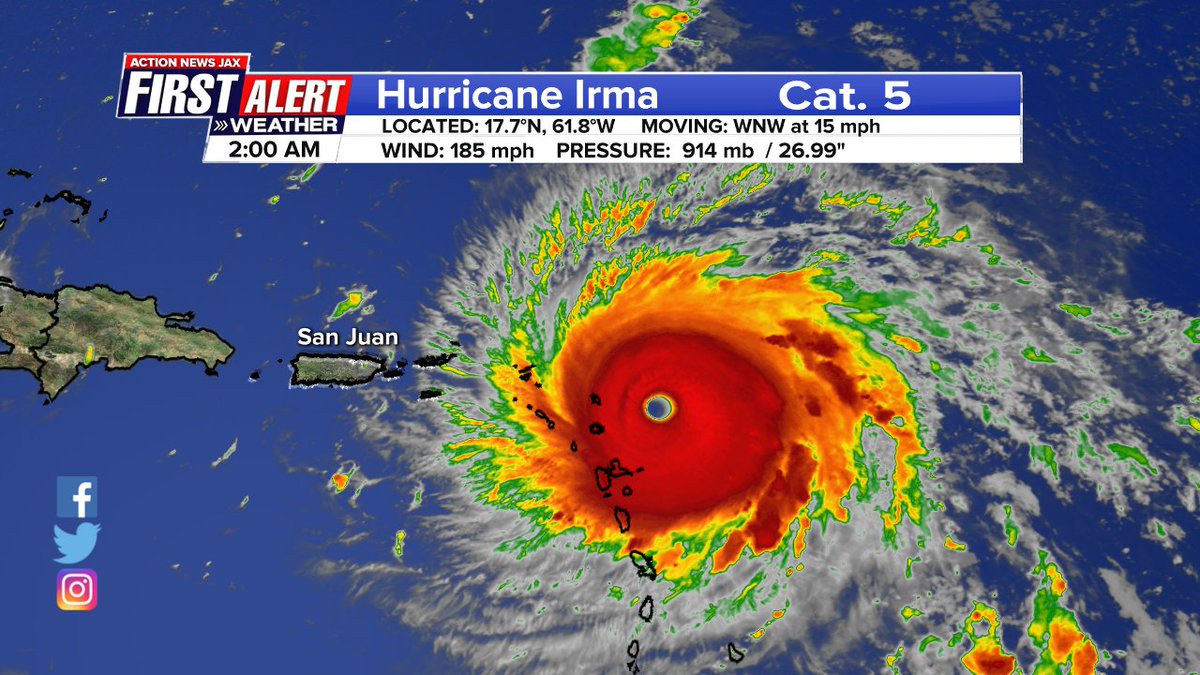
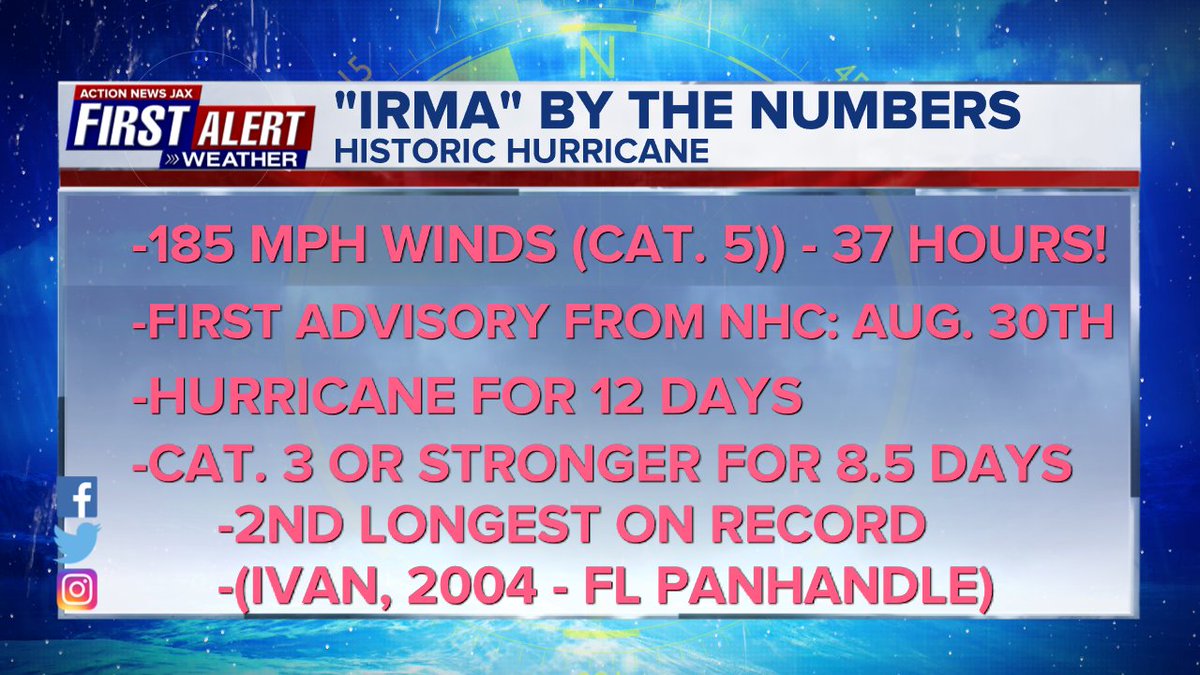
The hurricane began as a strong tropical wave that moved off the coast of Africa Aug. 27th & was upgraded to a tropical storm on the 30th.... & to a hurricane Aug. 31st. Given just about ideal conditions under which to strengthen & then maintain itself, Irma plowed into the Northern Lesser Antilles as a Cat. 5 hurricane - the strongest hurricane to ever hit the Windward Islands. From there the mighty storm gained just enough latitude while moving west/northwest to keep the eye north of Puerto Rico & Hispaniola before bending a little southwest & plowing across the north coast of Cuba. The landfall weakened the hurricane for a while but the warm water of the Florida Straits helped to restrengthen Irma to a Cat. 4 before the first U.S. landfall in the Keys on Sun., Sept. 10th... the next landfall was on the Florida mainland at Marco Island as a Cat. 3.... then a move north -- at times a little east -- up the spine of Florida before bending more northwest and finally become a remnant low Mon., Sept. 11th.
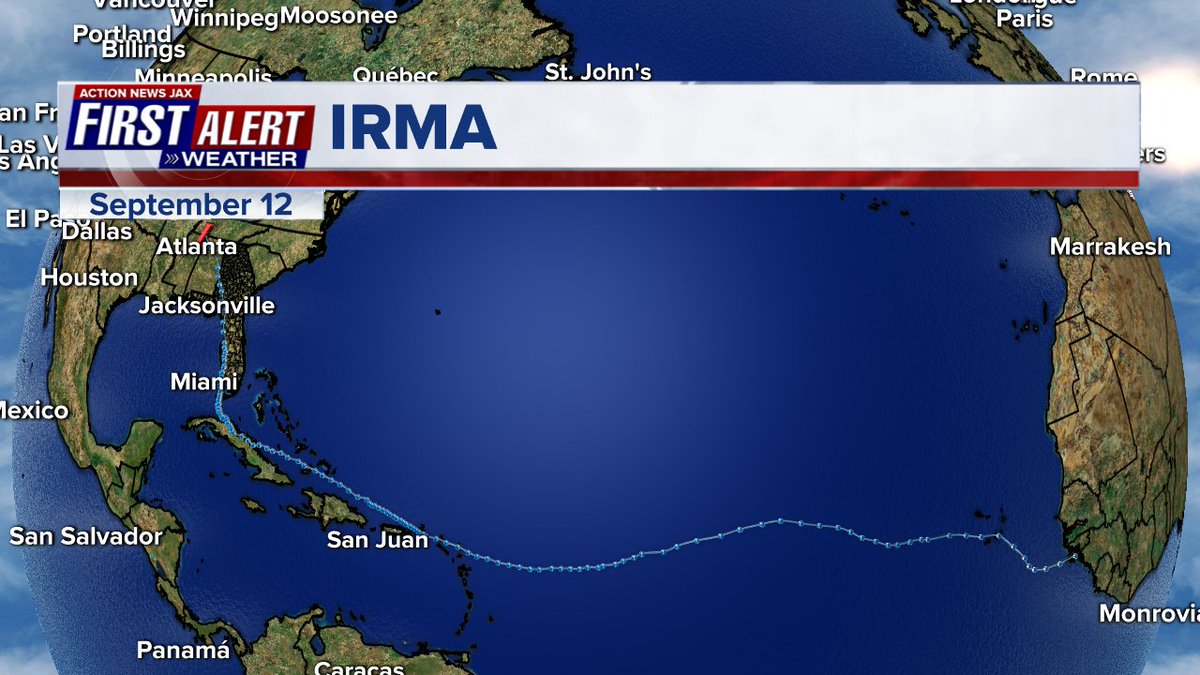
FORECAST:
It was obvious that Irma was going to be a major hurricane. Shear was low, the atmosphere moist & the ocean very warm. But the track was not so obvious - especially in the long term near the western edge of an expansive Bermuda high sprawled across the Central & Northern Atlantic. So the forecast was pretty straight forward & therefore accurate for the first week or so of Irma’s journey across the Atlantic. The forecast track was far more muddled on the “west end”. And I should point out here that no one or model exactly got this right. The question was not if Irma would turn north but when. Overall, the European model won the battle against the GFS (U.S. global forecast system) but neither were anywhere close to perfect & the even the European model had Irma staying east of Florida for a good part of the first week of Irma’s westward movement across the Atlantic. And the European generally was too far west on the Florida hit as well as the move north/northwest once inland. The GFS, however, was more “herky-jerky” as a whole. The UKMET model had its good & bad moments, but its best call was more of a southwest position before the turn north that took the eye over parts of Cuba. From there the UKMET was a bit too far southwest for a couple of cycles then too far east on the north turn (had the eye actually moving NE with a landfall still near Miami then north to near Jacksonville).
As late as Tue., Sept. 5th, I went on the air in the 10 & 11pm newscast on CBS47/Fox30 saying “there’s too much uncertainty, to put numbers - magnitude - on the impacts, but I am certain that there will be direct impacts”. By Wed., I emphasized the exact track will still change, but I did place numbers on the potential wind & rainfall. I also emphasized storm surge & tornadoes. Each day I then massaged these numbers as necessary & by Thu., issued by first storm surge forecasts averaging 3-5 feet but as much as 7 feet in spots. The first official storm surge forecasts from the Nat. Hurricane Center are not issued until a hurricane or tropical storm watch is issued for a specific area so those were not posted until after the 11pm advisory Fri., Sept. 8th. For the most part from Thu. through Sunday, my forecast did not change much from winds of 50-70 mph, gusts of 80-90 mph, possibly 100 mph... storm surge of 3-5 feet at the coast/intracoastal, locally 6-7 feet... 1-3 feet along the St. Johns River... rainfall of 6-12” but up to 15-18” locally... & a significant tornado threat (see “Talking the Tropics With Mike” as each update is still posted including the above forecast).
Two images below from WeatherBell. First is the GFS, 2nd is the European model.


Brian Tang/U Albany - average track error in kilometers out to 120 hours:

TRACK & STRENGTH
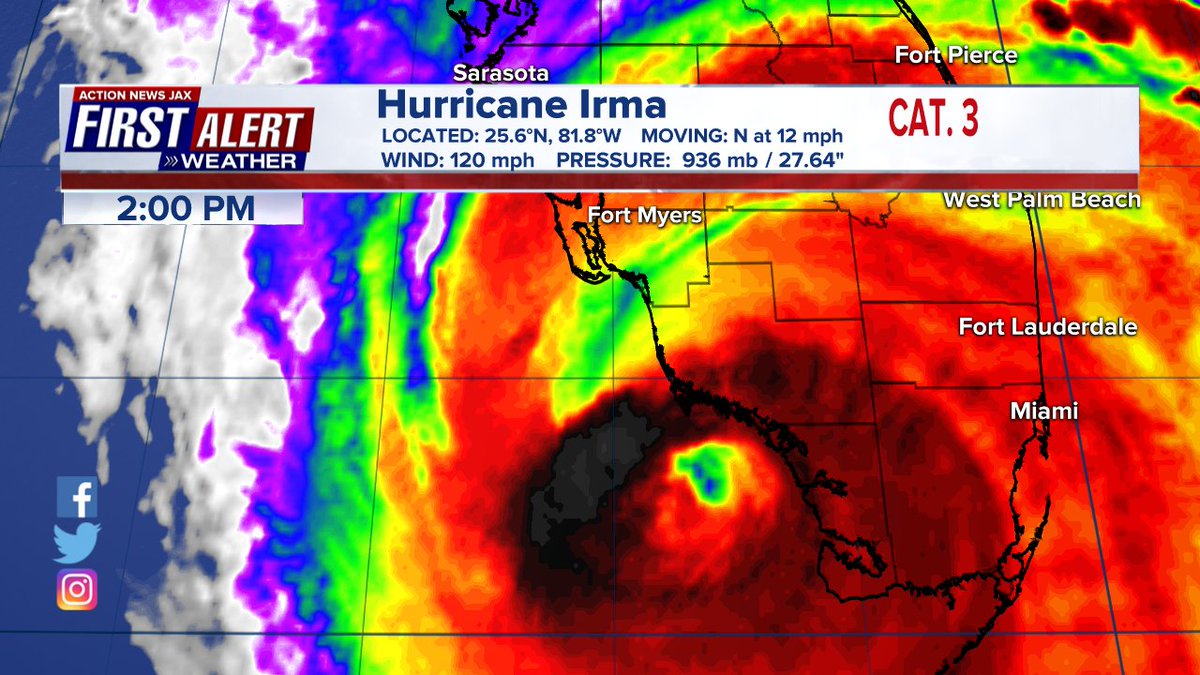
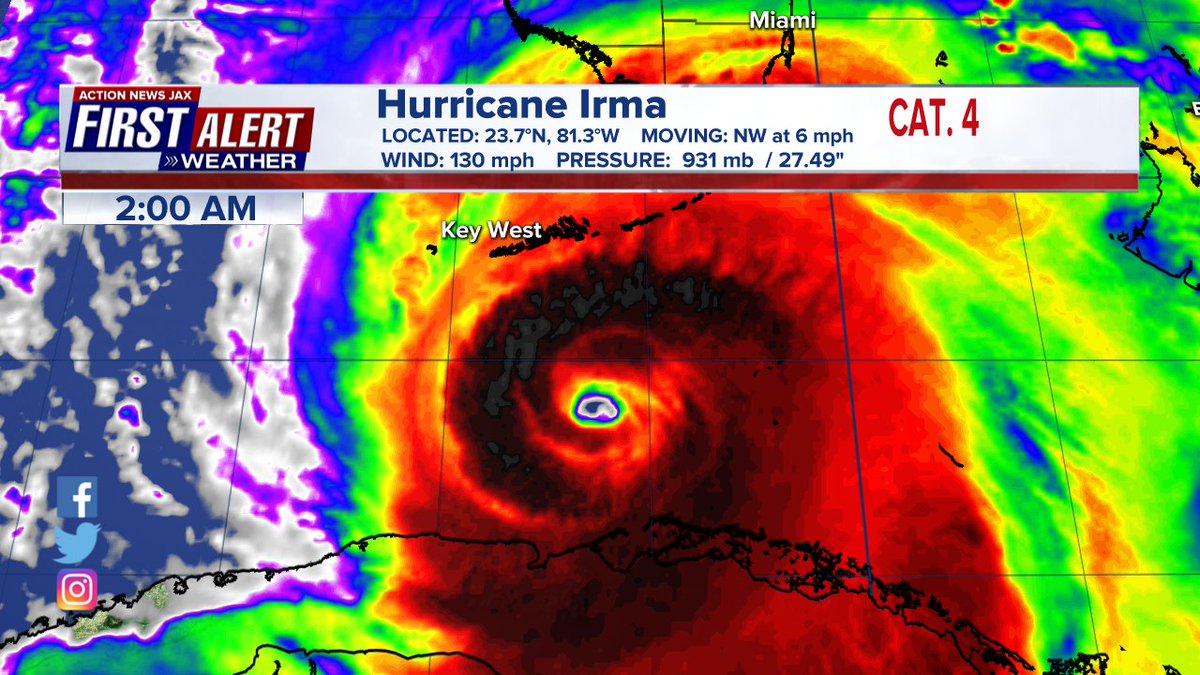
Irma did not encounter land until a brush with the north coast of Cuba Fri.-Sat., Sept. 8-9th. This 24+ hours near & over land caused some weakening but since the eye stayed partially over water & did not encounter mountainous terrain, Irma remained well organized. It was while over Cuba that Irma finally reached the western edge of the expansive Bermuda high & finally made the ever anticipated & forecast northward turn. The move back over the deep warm water of the Florida Straits helped Irma restrengthen into a Cat. 4 hurricane upon approach to the Keys early Sunday, Sept. 10th. This was the first U.S. landfall. Key West had high winds but was to the west of the eye sparing the city the worst of Irma. The Central Keys were not so lucky. The 2nd & final U.S. landfall occurred near 3:30pm Sunday at Marco Island on the southwest coast of Florida as a Cat. 3.
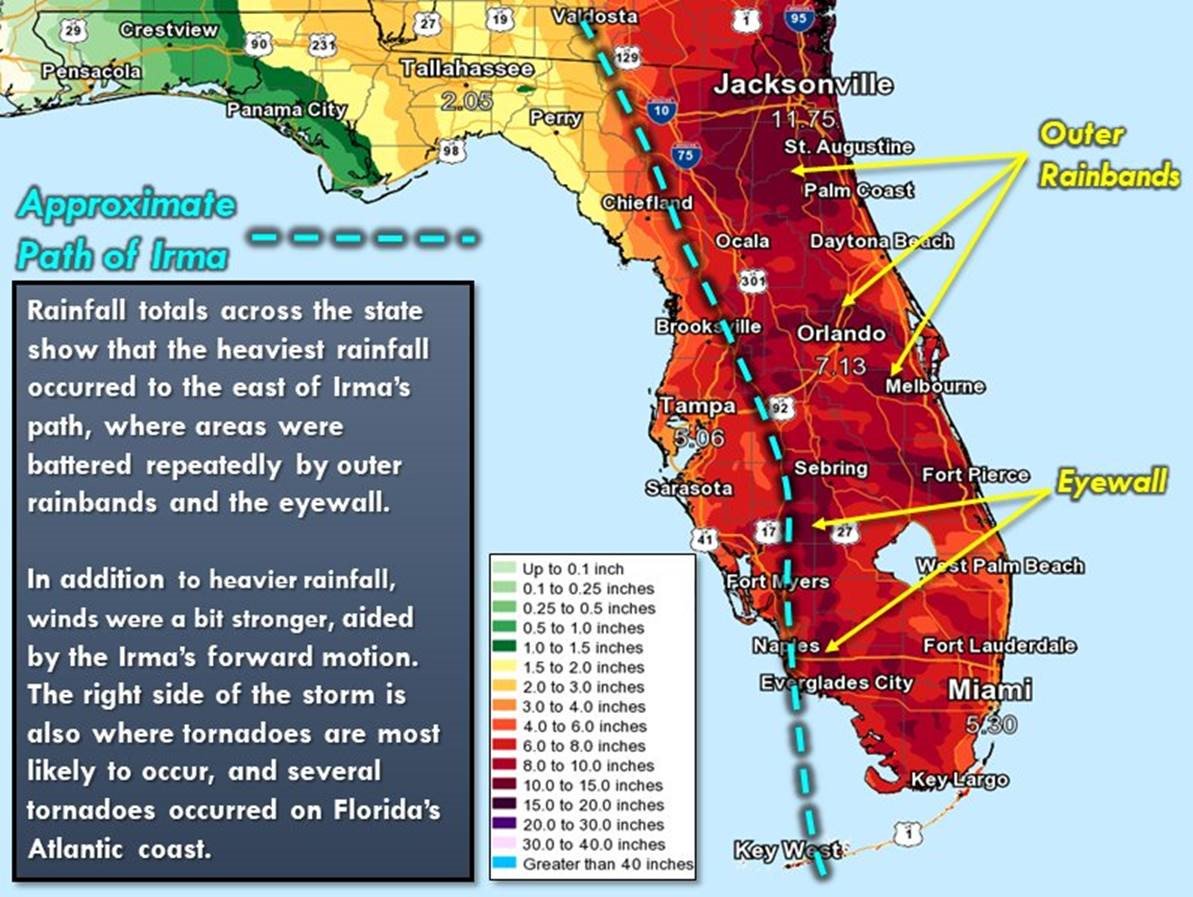
From there Irma stair-stepped its way northward up & near the spine of Fl. though the official track so far from the NHC is just inland from the west coast. Perhaps the mid level & low level circulations were not in sync, but it was obvious that the surface center was closer to - & possibly east of - I-75. As expected, Irma’s wind field greatly expanded once the eye left Cuba. Sustained tropical force winds extended 200+ miles to the east of the center. Irma steadily weakened over land but the eyewall managed to stay intact to north of Orlando... & Irma was officially downgraded to a tropical storm with the 8am update Mon., Sept. 11th due west of Jacksonville.
There were a lot of questions related to insurance regarding when & where Irma was downgraded. Unfortunately it does not matter as the hurricane deductible is applied for any named tropical cyclone, whatever the intensity. Given that all of NE Fl. & SE Ga. were in the northeast quadrant of Irma, wind, rain, storm surge & tornadoes were maximized.
90 minutes before Marco Island landfall:
Intensity gets back to Cat. 4 early Sun., Sept. 10 upon approach to the Keys:
Violent Cat. 5 moving closing in on the Northern Lesser Antilles:
WIND
A moderate nor’easter preceded Irma’s direct rain bands. The nor’easter produced sustained winds of 20-30 mph near the coast Sat.-Sat. night that then increased to 30-40 mph Sunday. The strongest winds were within the rain bands Sun. night into Mon. morning sustained 40-60 mph but with gusts of 70-90 mph. It’s pretty likely that there were some 100 mph gusts at times - mainly at & near the coast & St. Johns River. The changing direction played a huge role in damage & storm surge/flooding - from the east Sunday.... from the SE Sun. night & then from the south Monday. Numbers below show the minimum pressure in mb followed by the peak sustained winds then the peak wind gusts (including direction). So, for example, JIA - lat/long... min pressure of 986.6 mb on the 11th just before noon... max sustained wind 51 knots from 50 degrees & peak wind gust 75 knots from 50 degrees (NE) @ 7:41am on the 11th.....
KJAX-JACKSONVILLE INTERNATIONAL AIRPORT FL 30.49 -81.69 986.6 11/1156 050/051 11/0748 050/075 11/0741
KCRG-CRAIG MUNICIPAL AIRPORT FL 30.33 -81.52 987.0 11/1153 140/040 11/1227 140/061 11/1226
KNRB-MAYPORT NAVAL STATION FL 30.39 -81.42 988.5 11/1152 050/059 11/0738 050/076 11/0738
KNIP-JACKSONVILLE NAVAL AIR STATION FL 30.24 -86.68 984.6 11/1153 120/043 11/1053 050/063 11/0636
KVQQ-CECIL FIELD AIRPORT FL 30.22 -81.88 9999.0 / 040/024 11/0515 I 030/038 11/0435 I
KSGJ-SAINT AUGUSTINE AIRPORT FL 29.97 -81.33 994.3 11/0656 I 060/045 11/0506 I 050/062 11/0446 I
KFIN-BUNNELL FL 29.47 -81.21 9999.0 / 060/035 11/0235 100/053 11/0455
KVVG-THE VILLAGES FL 28.96 -81.97 9999.0 / 050/032 11/0250 070/047 11/1010 KOCF-
OCALA INTERNATIONAL AIRPORT FL 29.18 -82.22 995.3 11/0251 I 010/021 10/2221 I 030/034 11/0311 I
K42J-KEYSTONE HEIGHTS FL 29.85 -82.05 9999.0 / 070/031 11/0755 070/049 11/0555
KGNV-GAINESVILLE REGIONAL AIRPORT FL 29.68 -82.27 979.5 11/1053 040/035 11/0527 050/053 11/0517
KLCQ-LAKE CITY FL 30.18 -82.58 9999.0 / 020/031 11/0635 020/047 11/0635
KHOE-HOMERVILLE GA 31.06 -82.77 9999.0 / 030/020 11/0735 030/034 11/0735
KHOE-HOMERVILLE GA 31.06 -82.77 9999.0 / 030/020 11/0735 030/034 11/0735
KDQH-DOUGLAS MUNICIPAL AIRPORT GA 31.48 -82.86 9999.0 / 050/034 11/1355 040/051 11/1255
KAYS-WAYCROSS GA 31.25 -82.40 9999.0 / 040/030 11/0815 040/042 11/0955
KAMG-BACON COUNTY AIRPORT GA 31.54 -82.50 989.8 11/1553 140/021 11/1853 010/038 11/1314
KJES-JESUP GA 31.55 -81.88 9999.0 / 040/021 11/0856 030/033 11/0937
KBQK-BRUNSWICK/GLYNCO AIPORT GA 31.15 -81.47 9999.0 / 060/035 11/0915 060/052 11/0915
KSSI-ST. SIMONS/MALCOLM MCKINNON AIRPORT GA 31.15 -81.38 1006.1 11/0553 I 060/033 11/0610 I 050/049 11/0548 I
REMARKS: NON-METAR OBSERVATIONS... NOTE: ANEMOMETER HEIGHT IN METERS AND WIND AVERAGING PERIOD IN MINUTES INDICATED UNDER MAXIMUM SUSTAINED WIND IF KNOWN --------------------------------------------------------------------- LOCATION ID MIN DATE/ MAX DATE/ PEAK DATE/ LAT LON PRES TIME SUST TIME GUST TIME DEG DECIMAL (MB) (UTC) (KT) (UTC) (KT) (UTC) --------------------------------------------------------------------- BXTG1 - RAWS BAXLEY GA 31.71 -82.39 999/999 070/056 11/1504 XTRM - TERMINAL CHANNEL DOWNTOWN JACKSONVILLE 30.33 -81.62 983.0 11/1158 120/040 11/1143 120/065 11/1158
XJAK - BUCK ISLAND 30.39 -81.48 983.0 11/1235 060/055 11/0735 060/069 11/0735
XHUP - HUGUENOT PARK 30.41 -81.41 985.0 11/1116 065/057 11/0746 060/074 11/0741
XJAX - WEATHERFLOW JACKSONVILLE BEACH PIER 30.29 -81.39 986.0 11/1010 130/049 11/1310 097/065 11/1010
XLWS - WEATHERFLOW LEWIS ST. JOHNS 29.91 -81.33 984.0 11/1044 140/045 11/1149 130/065 11/1054
XHSE - WEATHERFLOW CRESCENT BEACH SUMMERHOUSE 29.71 -81.23 987.0 11/1005 145/047 11/1025 145/060 11/1055
OKEG1 - RAWS WAYCROSS GA 31.24 -82.40 999/999 035/055 11/1004
JONG1 - RAWS JONES ISLAND OKEFENOKEE NWR 30.82 -82.36 999/999 082/044 11/1801
TT331 - RAWS OKEFENOKEE NWR WEST 30.97 -82.40 999/999 032/048 11/0910
EDTF1 - EDDY TOWER BAKER COUNTY 30.54 -82.34 999/999 114/024 11/1304
LGRF1 - RAWS LAKE GEORGE OCALA NF 29.38 -81.81 999/999 208/034 11/1704
TS818 - RAWS OKEFENOKEE NWR EAST 30.74 -82.13 999/999 114/042 11/1256
OLSF1 - RAWS OLUSTEE BAKER 30.25 -82.42 999/999 173/040 11/1704
STRG1 - RAWS STERLING GLYNN GA 31.25 -81.61 999/999 073/048 11/1104
FAWN LIVE OAK FL 30.30 -82.90 999/999 999/042 11/0615
XJEK - JEKYLL ISLAND GA 31.05 -81.41 988.0 11/1322 130/050 1337 080/067 11/0837 1
NNE ST. AUGUSTINE BEACH 29.86 -81.26 999/999 999/068 11/0700
CRESCENT BEACH 29.72 -81.23 999/999 999/058 11/0720
PALATKA AIRPORT 29.66 -81.69 999/999 999/053 11/0055
3 SE WELAKA 29.44 -81.63 999/999 999/057 11/0421
2 SSE KINGSLAND 30.75 -81.65 999/999 999/049 11/0511
2 W DEENWOOD 31.25 -82.40 999/999 999/048 11/0604
3 NE YULEE 30.66 -81.54 999/999 999/047 10/2259
1 SW ORTEGA 30.26 -81.72 999/999 999/047 11/0212
PALM COAST 29.57 -81.21 999/999 999/046 11/0729
4 SW BAXLEY 31.71 -82.39 999/999 999/045 11/0704
2 NNE BAKERSTOWN 29.39 -81.47 999/999 999/045 11/0932
SUWANNE COUNTY AIRPORT 30.30 -83.02 999/999 999/043 11/0315
BAXLEY MUNICIPAL AIRPORT 31.71 -82.39 999/999 999/042 11/0715
3 N BUNNELL 29.51 -81.25 999/999 999/042 11/0042
5 ESE THALMANN 31.26 -81.61 999/999 999/042 11/0704
11 NNW STEVEN FOSTER ST PK 30.98 -82.40 999/999 999/042 11/0510
1 SE ORTEGA 30.25 -81.69 999/999 999/040 11/0203
3 S BOYS ESTATE 31.27 -81.48 999/999 999/030 11/0437
5WNW NEWBERRY 29.67 -82.70 999/999 999/039 11/0315
HAZLEHURST 31.88 -82.65 999/999 999/039 11/0655
5 WNW OCALA AIRPORT 29.20 -82.30 999/999 999/039 11/0147
3S BELLAIR 30.18 -81.81 999/999 999/039 11/0739
3 W BELLAIR 30.18 81.91 999/999 999/039 11/0739
5 SE ALACHUA 29.73 -82.42 999/999 999/037 11/0229
1 SW SAN PABLO 30.27 -81.46 999/999 999/037 11/0246
1 WNW STEVEN FOSTER ST PK 30.83 -82.36 999/999 999/036 11/0801
3 SSE SAN MARCO 30.27 -81.65 999/999 999/036 11/0243
2 NNW TALLYRAND 30.39 -81.65 999/999 999/036 11/0400
5 WSW DURBIN 30.05 -81.54 999/999 999/035 11/0130
1 SE SAN MARCO 30.30 -81.64 999/999 999/034 11/0115
3 WSW KINGSLAND 30.77 81.73 999/999 999/034 11/0657
4 NNW VILANO BEACH 30.02 -81.32 1005.0 11/0308 I 050/051 10/2223 I 055/060 11/0308 I
FLOODING
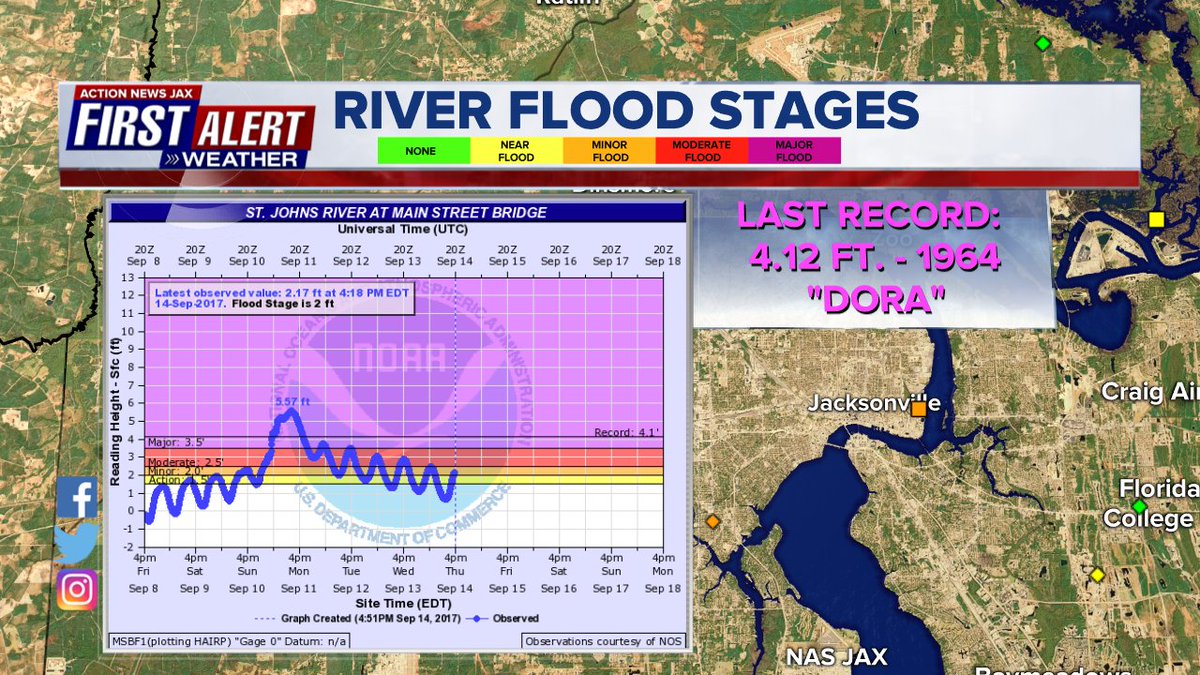
The “local” nor’easter preceding the true arrival of Irma exacerbated the flooding that peaked Sun. night into Monday. The persistent strong onshore flow - out of the east - pushed extra water into the intracoastal & overall watersheds of NE Fl. Throw in the heavy rainfall, strong shifting winds, wave action & high astronomical tides (just past new moon) & we saw extensive - & in some cases - record flooding. Saturated ground from a summer of heavy rain did not help matters. Much of the flooding headlines went to downtown Jacksonville - namely Riverside & San Marco where there was the worst flooding since at least 1846. It was a combination of a “perfect storm” - lots of ocean & fresh water, high tides & a very strong wind out of the south. Flood stage is 2 feet... major flooding begins at 3.5 feet... the previous record was 4.1 feet.... so the 5.57 feet (Main St. Bridge) early Mon. afternoon, the 11th far exceeded any other floods on record at & near The Landing & beat the hurricane Dora (1964) high mark by more than a foot! There was extensive flooding all up & down St. Johns River as well as on virtually all tributaries. Black Creek hit a record 30.52 feet at Middleburg -- nearly double the flood stage. Major flooding occurred along the St. Marys River & record flooding occurred along the Santa Fe River in Columbia Co. Higher than average tides with minor to moderate flooding continued for 2+ weeks after Irma.
MAXIMUM STORM SURGE AND STORM TIDE... OFFICIAL TIDE GAUGES NOTED WITH LEADING G --------------------------------------------------------------------- COUNTY CITY/TOWN SURGE TIDE DATE/ BEACH OR LOCATION (FT) (FT) TIME EROSION ---------------------------------------------------------------------
Max storm surge is the first number - so G Bings Landing - 4/19 feet
FLAGLER G BINGS LANDING 4.19 4.19 11/0824 UNKNOWN DUVAL
G BUCKMAN BRIDGE 5.71 5.26 11/1118 UNKNOWN I
GLYNN
G ST SIMONS ISLAN 3.93 3.93 11/1545 UNKNOWN I
DUVAL G BROWARD RIVER 2.78 2.78 11/0445 UNKNOWN I
DUVAL G CLAPBOARD CREEK 3.47 3.47 11/1715 UNKNOWN
CAMDEN G SEA CAMP DOCK O 3.13 3.13 11/0600 UNKNOWN
DUVAL G DUNN CREEK 4.77 4.77 11/0930 UNKNOWN
DUVAL G DAMES POINT BRI 5.97 3.69 11/1724 UNKNOWN
PUTNAM G DUNNS CREEK NEA 3.60 3.60 11/2315 UNKNOWN
ST. JOHNS G DURBIN CREEK AT 5.61 5.61 11/2000 UNKNOWN I
NASSAU G FERNANDINA BEAC 7.78 3.61 11/0548 UNKNOWN
DUVAL G CEDAR RIVER AT 5.66 5.66 11/1630 UNKNOWN
DUVAL G JULINGTON CREEK 5.35 5.35 11/1430 UNKNOWN
CAMDEN G ST MARYS RIVER 1.10 1.10 11/1815 UNKNOWN
DUVAL G MAYPORT 6.44 3.62 11/0654 UNKNOWN
DUVAL G SOUTHBANK RIVER 6.61 4.94 11/1624 UNKNOWN
ST JOHNS G RACY POINT 4.72 3.96 11/2100 UNKNOWN
DUVAL G NASSAU RIVER NE 6.21 6.21 11/0730 UNKNOWN I
DUVAL G POTTSBURG CREEK 4.76 4.76 11/1700 UNKNOWN
DUVAL G TROUT RIVER AT 2.91 2.91 11/0600 UNKNOWN I
ST JOHNS G TOLOMATO RIVER 3.61 3.61 11/0606 UNKNOWN
CAMDEN G SATILLA RIVER A 3.44 3.44 11/1845 UNKNOWN
ST JOHNS G DEEP CREEK AT S 5.75 5.75 12/0200 UNKNOWN
REMARKS: OFFICIAL TIDE GAUGE SITES HAVE STORM TIDE WITH RESPECT TO MHHW. TIMES IN UTC. TIDE GAUGE AT BUCKMAN BRIDGE STOPPED REPORTING 9/11 1347UTC AND THEREFORE MAY HAVE EXPERIENCED HIGHER WATER LEVELS. FURTHER DETAILED ANALYSIS IS BEING DONE NEAR DOWNTOWN JAX ON WATER LEVELS AND STORM SURGE.
St. Johns River - Main St., D'town Jacksonville:
 0
0Downtown Jax early Mon. afternoon, 11th:
 1
1St. Marys, Ga:
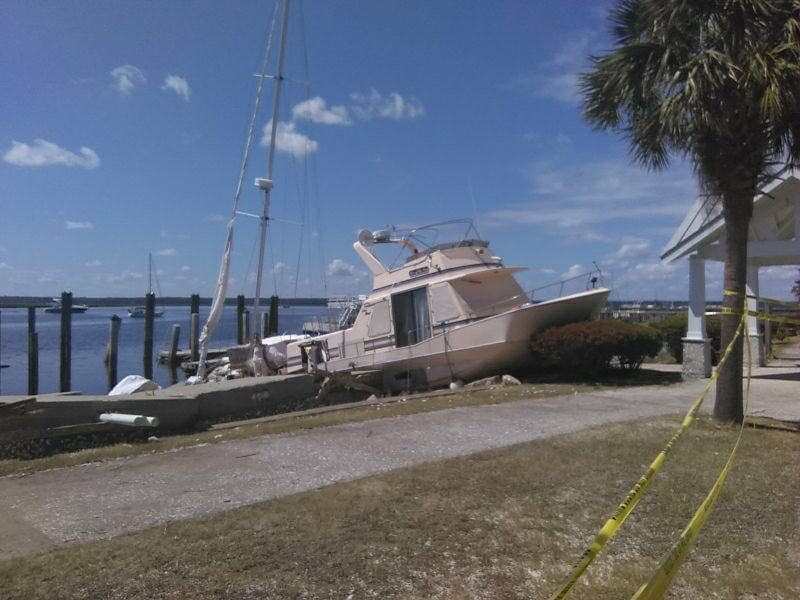
Memorial Park, downtown Jax:

Neighbors helping out in Clay Co. to dry out & salvage photos:

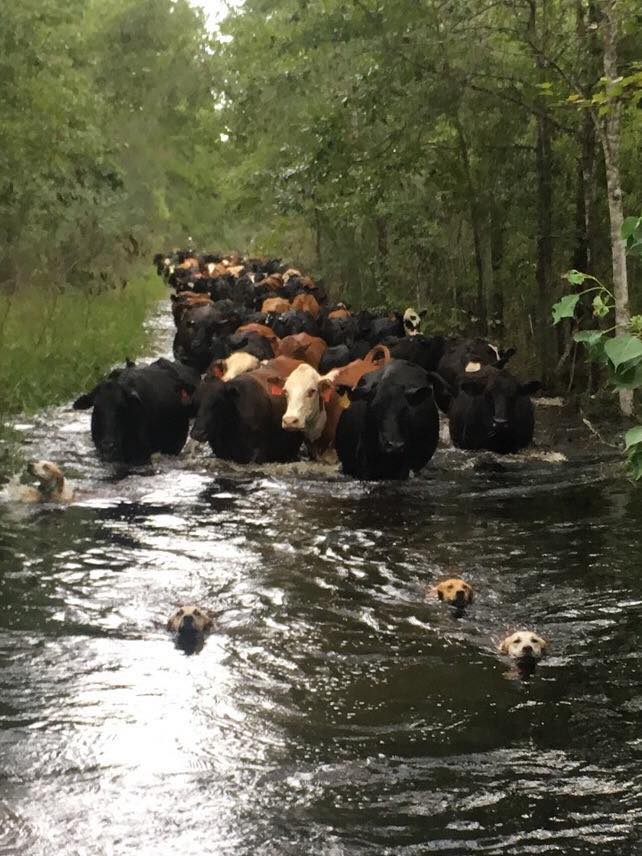
Dogs herding cattle to higher ground:
RAIN
Rainfall averaged about 7 - 12” but with local spots seeing as much as 14-16”. Very localized areas closer to the coast had nearly 20” if Fri./Sat./Sun./Mon. are combined as the “local” Nor’easter triggered some locally heavy rain bands well before the true Irma bands.
STORM TOTAL RAINFALL FROM 1200 UTC SEP 11 UNTIL 1200 UTC SEP 12 --------------------------------------------------------------------- CITY/TOWN COUNTY ID RAINFALL LAT LON (IN) DEG DECIMAL ---------------------------------------------------------------------
so.... 4 miles west of Bellair, Gilchrist Co. - 15.11"....
4 W BELLAIR GILCHRIST 15.11 29.75 -82.93
FERNANDINA BEACH NASSAU 12.70 30.65 -81.45
GAINESVILLE REGIONAL APT ALACHUA GNV 12.40 29.67 -82.34 2.4 NW
GAINESVILLE ALACHUA FL-AL-57 12.22 29.69 -82.36
0.9 ESE STARKE BRADFORD FL-BF-2 11.74 29.94 -82.10
8.8 S INTERLACHEN MARION FL-MR-46 11.51 29.48 -81.90
8.8 E MIDDLEBURG CLAY 11.32 30.04 -81.75
7.5 WSW GAINESVILLE ALACHUA FL-AL-60 11.15 29.63 -82.45
1 WNW ORTEGA DUVAL 11.11 30.27 -81.72
10 SW JACKSONVILLE DUVAL 11.04 30.24 81.79
1.8 WSW ORANGE PARK CLAY FL-CY-25 11.03 30.15 -81.73
5.2 NNW ALACHUA ALACHUA FL-AL-56 11.03 29.84 -82.51
12 SSE JACKSONVILLE DUVAL 11.00 30.18 81.57
3.5 NNW EAST PALATKA PUTNAM 10.96 29.69 -81.62
1.7 SE GAINESVILLE ALACHUA FL-AL-26 10.94 29.65 -82.32
3.8 W GAINESVILLE ALACHUA FL-AL-10 10.89 29.67 -82.40
2.4 SW GAINESVILLE ALACHUA FL-AL-50 10.75 29.64 -82.36
2.1 NNE MICANOPY ALACHUA FL-AL-51 10.70 29.53 -82.26
2.6 WNW GREEN COVE SPRIN CLAY FL-CY-42 10.48 30.00 -81.72
1.8 ESE KEYSTONE HEIGHTS CLAY FL-CY-24 10.36 29.76 -82.01
6 S NAHUNTA BRANTLEY 10.34 31.12 -81.98
7.7 W GAINESVILLE ALACHUA FL-AL-55 10.33 29.67 -82.46
ST. AUGUSTINE SOUTH ST. JOHNS 10.22 29.84 -81.31
4.6 N OCALA MARION FL-MR-57 10.12 29.25 -82.13
4 NE SATSUMA PUTNAM 10.05 29.59 -81.61
11.2 SW OCALA MARION FL-MR-59 9.96 29.07 -82.26
6.3 S FERNANDINA BEACH NASSAU 9.92 30.56 -81.45
9.80 SW OCALA MARION FL-MR-43 9.91 29.08 -82.24
10.7 WSW OCALA MARION FL-MR-56 9.90 29.12 -82.29
0.4 N FERNANDINA BEACH NASSAU 9.86 30.66 -81.45
HOMELAND CHARLTON 9.85 30.85 -82.02
3 N OLUSTEE BAKER 9.76 30.24 -82.43
5 ESE THALMANN GLYNN 9.65 31.29 -81.69
14.30 S OCALA MARION FL-MR-36 9.65 28.97 -82.13
3 SSW BELLEVIEW MARION 9.64 29.01 -82.07
0.9 NE RAIFORD UNION 9.62 30.07 -82.23
4.8 E BELLEVIEW MARION FL-MR-18 9.50 29.05 -81.97
10 SW FOLKSTON CHARLTON 9.30 30.73 -82.13
JACKSONVILLE INTL APT DUVAL JAX 9.20 30.49 81.69
5.9 S PALM COAST FLAGLER FL-FL-25 9.10 29.48 -81.21
4.9 NE OCKLAWAHA MARION FL-MR-22 9.00 29.09 -81.87
5.4 W GAINESVILLE ALACHUA FL-AL-48 8.87 29.67 -82.43
1 WSW ATKINSON BRANTLEY 8.74 31.21 -81.87
2 NE FARGO CLINCH 8.66 30.70 -82.54
1.1 SE OCALA MARION FL-MR-54 8.63 29.17 -82.12
2.3 ENE SCREVEN WAYNE 8.56 31.49 -81.98
9 N FLORAHOME CLAY 8.55 29.86 -81.88
10 NE KEYSTONE HEIGHTS CLAY FL-CY-38 8.55 29.88 -81.91
1.0 ENE BUNNELL FLAGLER FL-FL19 8.48 29.47 -81.24
5 NNW BLACKSHEAR PIERCE 8.45 31.36 -82.28
SUWANNEE RIVER US HWY 44 8.44 30.68 82.56
7.9 SSW LAKE CITY COLUMBIA FL-CB-12 8.44 30.08 -82.69
3.2 SW HIGH SPRINGS ALACHUA FL-AL-17 8.23 29.78 -82.63
MAYPORT NAVAL STATION DUVAL NRB 7.96 30.38 -81.41
11 NNW STEVEN FOSTER ST. CHARLTON 7.81 32.57 -83.19
7 NNW TAYLOR BAKER 7.79 30.53 -82.34
0.6 ESE PALM COAST FLAGLER FL-FL-21 7.67 29.56 -81.20
1 WNW STEVEN FOSTER ST. 7.66 30.83 82.36
8.0 ENE TRENTON GILCHRIST FL-GC-1 7.60 29.65 -82.69
5 WNW JACKSONVILLE HEIGH DUVAL 7.54 30.27 -81.86
5 SE ALACHUA ALACHUA 7.51 29.72 -82.42
PENNEY FARMS CLAY FL-CY-41 7.46 29.98 -81.81
6.7 WSW JACKSONVILLE DUVAL 7.37 30.30 -81.76
4 NNE MANDARIN DUVAL 7.35 30.20 -81.61
4.2 NNW JESUP WAYNE 7.22 31.65 -81.92
LITTLE SATILLA RIVER 7.14 31.45 82.05
JACKSONVILLE NAS DUVAL NIP 7.08 30.23 -81.68
10 NNW JESUP WAYNE 6.96 31.73 -81.95
WAYCROSS WARE 6.86 31.21 -82.36
3 WSW KINGSLAND INLAND CAMDEN 6.84 30.77 -81.71
4.6 SSE MICANOPY MARION FL-MR-42 6.83 29.44 -82.25
3.5 ENE KEYSTONE HEIGHTS CLAY FL-CY-7 6.78 29.79 -81.98
1.9 S PALM COAST FLAGLER FL-FL-26 6.72 29.54 -81.21
4 NW TRENTON GILCHRIST FL-GC-8 6.53 29.65 -82.86
3.5 NE PEARSON ATKINSON 6.50 31.33 -82.81
SATILLA RIVER HWY 158 6.49 31.30 82.56
BACON COUNTY AIRPORT BACON 6.04 31.54 82.51
2 W DEENWOOD WARE 5.98 31.24 -82.40
4 SW BAXLEY APPLING 5.89 31.72 -82.40
ALAPAHA RIVER HWY 94 5.82 30.70 83.03
1 WNW ALACHUA ALACHUA 5.70 29.78 -82.50
0.5 NNW NEPTUNE BEACH DUVAL FL-DV-13 4.97 30.32 -81.40
DOCTORTOWN WAYNE 4.92 31.65 -81.83
3 SSW FOLKSTON CHARLTON 4.66 30.79 -82.03
1 SSE LUMBER CITY 4.22 31.92 82.67
NOAA:
TORNADOES
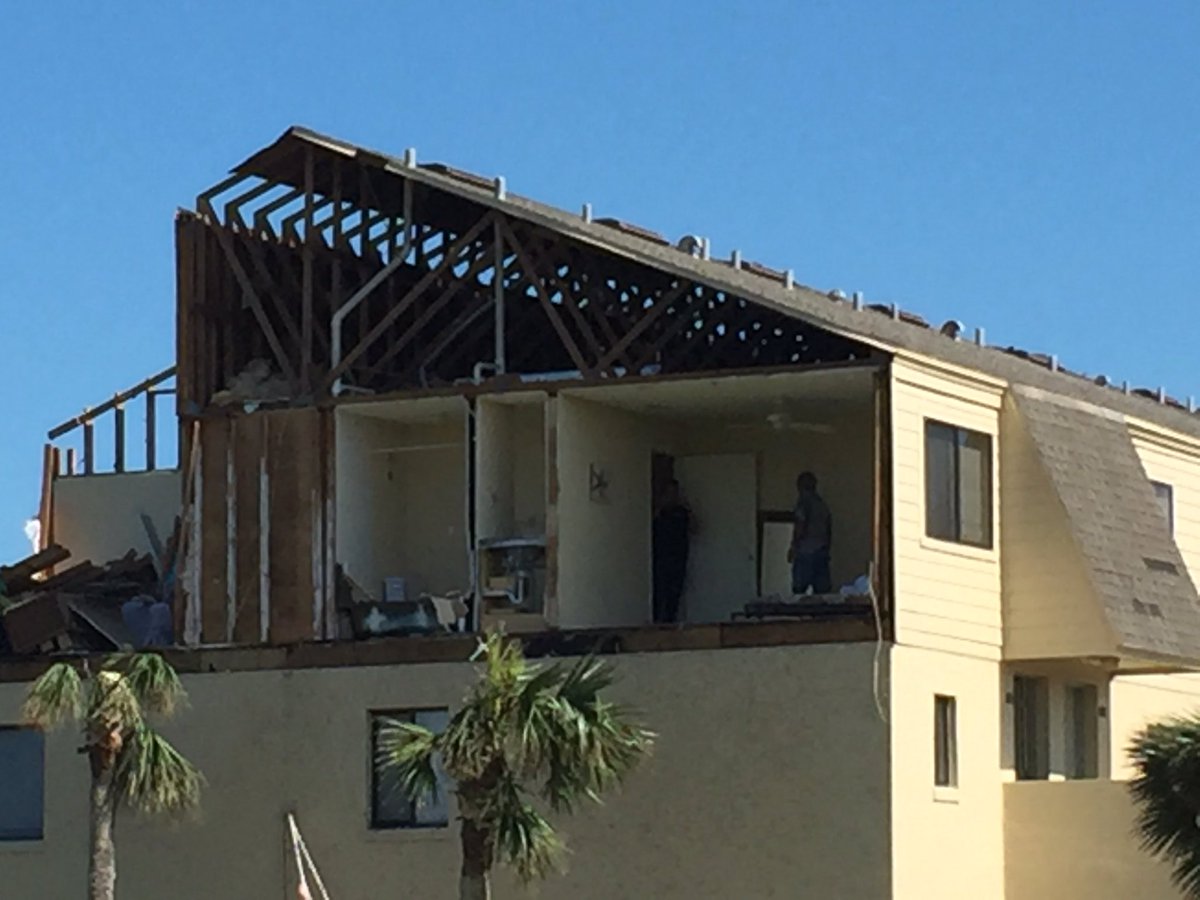
There were at least 6 tornadoes, but it’s pretty likely that there were more. One of the strongest was an EF-2 tornado near Crescent Beach which I personally inspected. This was clearly a waterspout that came roaring ashore with winds near 130 mph. Since Irma’s eye came ashore on the southwest coast, much of Eastern Florida was in the tornado favorable quadrant with several tornadoes reported from the Upper Keys to Miami, Orlando, Melbourne, Daytona & Jacksonville.
1 SSE VILANO BEACH St. Johns 10/2350 EF1 29.93 -81.30 THIS TORNADO MAY HAVE INITIATED AS A WATERSPOUT THAT MOVED ONSHORE AT VILANO BEACH. MINIMAL DAMAGE WAS SEEN IN VILANO BEACH, WITH MORE TREE DAMAGE OBSERVED WEST OF VILANO BEACH. A FEW TREES WERE SNAPPED AND UPROOTED. RADAR INDICATED A TORNADO DEBRIS SIGNATURE. ESTIMATED PEAK WINDS WERE 85-100 MPH. THE PATH LENGTH WAS ABOUT 4 MILES AND THE WIDTH OF THE VORTEX WAS ABOUT 200 YARDS. THE TORNADO DAMAGE SURVEY BEGIN IN VILANO BEACH FLORIDA (29.93, -81.30) AROUND 7:50 PM LOCAL TIME ON 9/10. THE DAMAGE ENDED 4 MILES WEST OF VILANO BEACH (29.95, -81.38) AROUND 7:56 PM ON 9/10.
1 N ST. AUGUSTINE St. Johns 10/1740 EF1 29.90 -81.31 THIS TORNADO LIKELY BEGAN AS A WATERSPOUT THAT MOVED ONSHORE. SIGNIFICANT TREE DAMAGE OCCURRED AT HUGUENOT CEMETERY, WITH MORE TREE DAMAGE WESTWARD TOWARD HIGHWAY 1. THE TIME OF DAMAGE WAS BASED ON RADAR. PEAK WINDS WERE 85-100 MPH WITH TOTAL PATH LENGTH OF 1 MILE AND WIDTH OF 50 YARDS. THE TORNADO STARTED IN ST. AUGUSTINE (29.90, -81.31) AROUND 1:40 PM AND TRACKED TOWARD 1 MILE WEST OF ST. AUGUSTINE (29.90, -81.33) ENDING AROUND 1:45 PM.
1 SE CRESCENT BEACH ST. JOHNS 11/0415 EF2 29.72 -81.23 SIGNIFICANT STRUCTURAL DAMAGE OCCURRED AT SUMMER HOUSE VACATION RENTALS. THERE WERE CLEAR SIGNS OF A CIRCULATION IN THE DAMAGE PATTERN. TREE DAMAGE OCCURRED TO A1A. THE TORNADO APPEARED TO DISSIPATE OVER THE INTERCOASTAL WATERWAY. PEAK WINDS WERE 110-130 MPH. TOTAL PATH LENGTH WAS ABOUT 1 MILE WITH WIDTH OF 300 YARDS. THE TORNADO BEGAN AROUND 1:15 AM ABOUT 2 MILES SOUTH OF CRESCENT BEACH (29.72, -81.23) AND ENDED AROUND 1:20 AM ABOUT 3 MILES SSW OF CRESCENT BEACH (29.72, -81.25).
2 NNW FERNANDINA BEACH NASSAU 11/0625 EF0 30.69 -81.46 NO DAMAGE WAS REPORTED AS THE TORNADO TRACKED GENERALLY OVER OPEN MARSH. THERE WAS A CLEAR TORNADO DEBRIS SIGNATURE ON RADAR. THE TIME OF THE TORNADO WAS ESTIMATED BASED ON RADAR. PEAK WINDS REACHED 85-100 MPH. THE TOTAL PATH LENGTH WAS 11 MILES WITH UNKNOWN WIDTH. THE TORNADO STARTED NEAR FORT CLINCH (30.69, -81.46) AROUND 2:25 AM AND ENDED ABOUT 11 MILES WEST OF FORT CLINCH (30.69, -81.64) AROUND 2:35 AM.
2 NNW AMELIA CITY NASSAU 11/0625 EF0 30.61 -81.47 NO DAMAGE WAS REPORTED AS THE TORNADO TRACKED MOSTLY OVER OPEN TERRITORY. THERE WAS A CLEAR TORNADO DEBRIS SIGNATURE ON RADAR. THE TIME OF THE EVENT WAS BASED ON RADAR. PEAK WINDS REACH 85-100 MPH. PATH LENGTH WAS ABOUT 11 MILES AND THE WIDTH WAS UNKNOWN. THE TORNADO STARTED ABOUT 5 MILES SOUTH OF FORT CLINCH STATE PARK (30.61, -81.47) AROUND 2:25 AM AND ENDED ABOUT 9 MILES SOUTHWEST OF FORT CLINCH STATE PARK (30.61, -81.57) AROUND 2:30 AM.
2 S MARINELAND Flagler 11/0020 EF0 29.64 -81.21 INITIAL AERIAL SURVEY FOUND A TORNADO PATH OF TREE DAMAGE. THERE WAS NO STRUCTURAL DAMAGE REPORTED. A TORNADO DEBRIS SIGNATURE WAS DETECTED ALONG THE TORNADO PATH. PEAK WINDS WERE 85-100 MPH. THE PATH LENGTH WAS ABOUT 4 MILES AND THE WIDTH WAS UNKNOWN. THE TORNADO STARTED ABOUT 1 MILE SOUTH OF MARINELAND (29.64, -81.21) AROUND 8:20 PM AND TRACKED TO ABOUT 4 MILES WEST OF MARINELAND (29.67, -81.29) AROUND 8:30 PM.
EF-2 tornado damage near Crescent Beach:
PERSONAL (BURESH) NOTES/OBSERVATIONS/OPINIONS
I’ve been asked time & time again how much I slept. I didn’t keep a log, but I can tell you I wasn’t sawing many logs most of the time. :) My average time away from work was 2:30-6:30am the week leading up to Irma’s Fl. landfall. My longest uninterrupted stretch on t.v. was from 1pm Sunday, the 10th to 9am Mon., the 11th. There were far too many live radio updates to count.
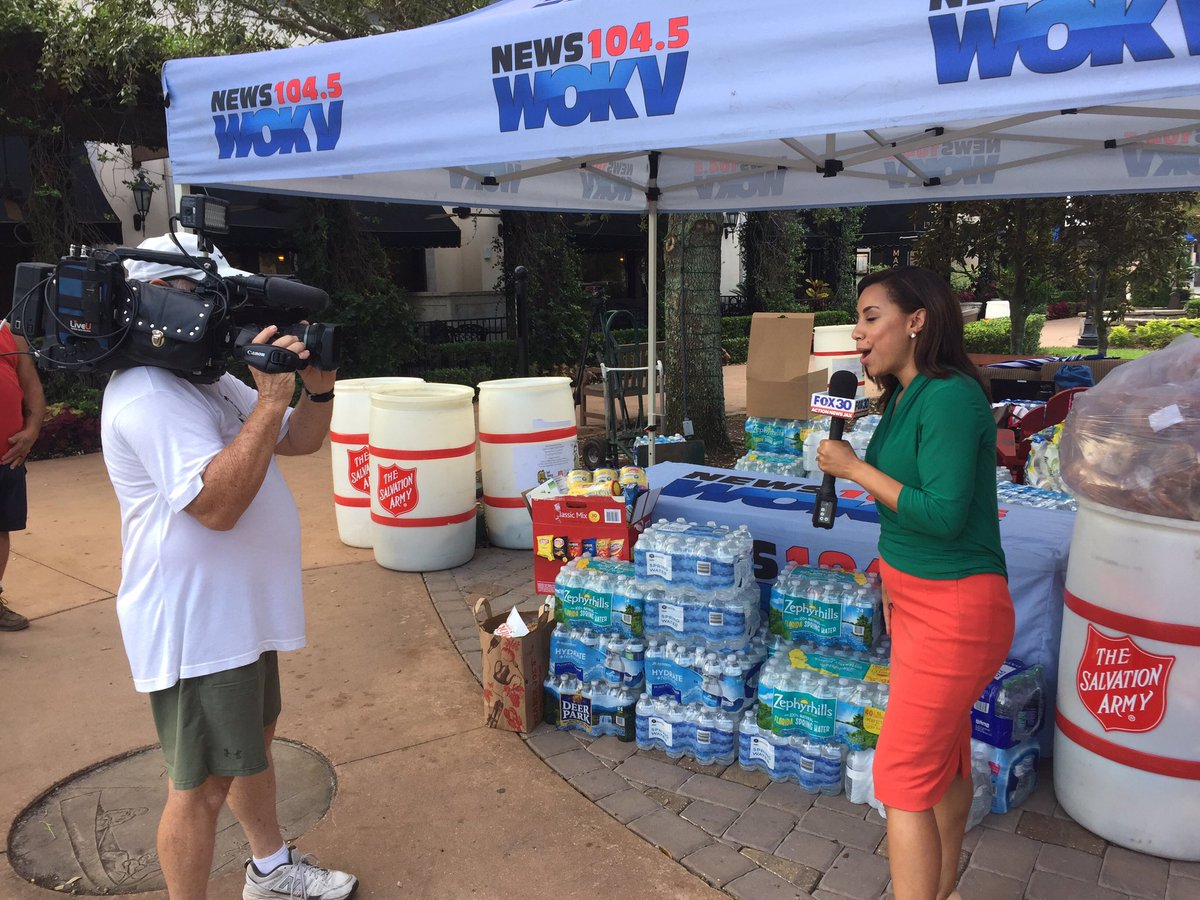
News 104.5 WOKV was wall to wall through the weekend & Mon. of Irma.... & for most of the time through the rest of the week following Irma. Rich Jones organized a timely round-table discussion the Fri. before Irma hit that included me, JEA, the mayor, Emergency management folk & former Meteorologist-In-Charge at the Jax N.W.S., Steve Letro. The Cox Media Group then followed up with a “supply drive” with the Salvation Army on Fri., Sept. 15th which filled up 4 trucks!
Fri., Sept. 9th radio roundtable:

Supply drive Fri., Sept. 15th:
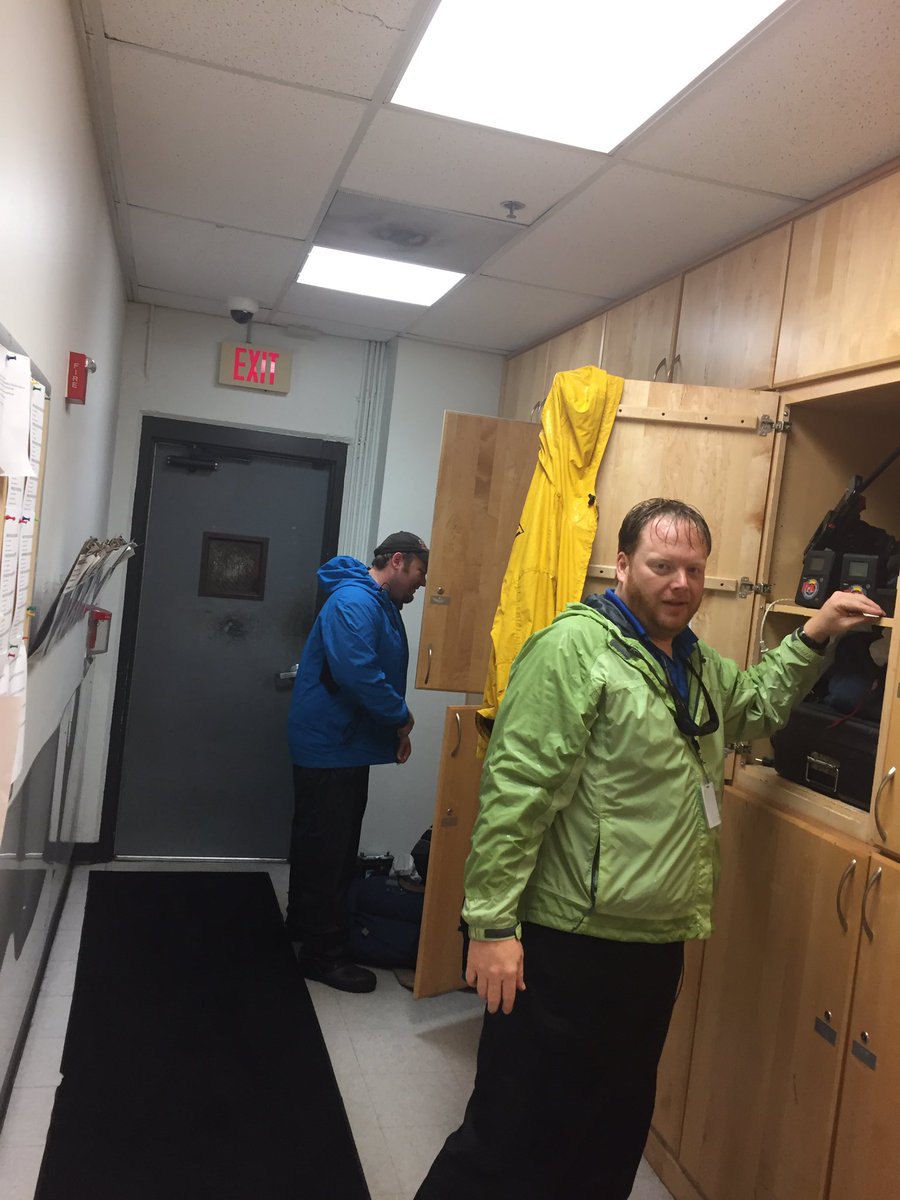
The effort & work by all the t.v. (CBS47/Fox30) & radio staff was second to none. I’m biased, of course, but I saw some of the very best local news coverage of a breaking weather event I’ve seen in my career. Sunday evening we had First Alert Storm Tracker in the vicinity of several tornadoes enabling us to report on damage within minutes of the actual tornado. Monday, the 11th we had timely reports in the field as trees fell & flood waters rose.
Soaked videographers:
The First Alert Weather Center staff stayed on point for a long time - which is very challenging during such a long & intense storm. But we had a tremendous mix of graphics that helped show the forecast & tell the story. I would not have been effective alone - priceless help & a team effort -- Garrett Bedenbaugh, Arielle Nixon & Erin Clanahan.

Giving the "First Alert" on offshore circulations that could become tornadoes once to the coast:
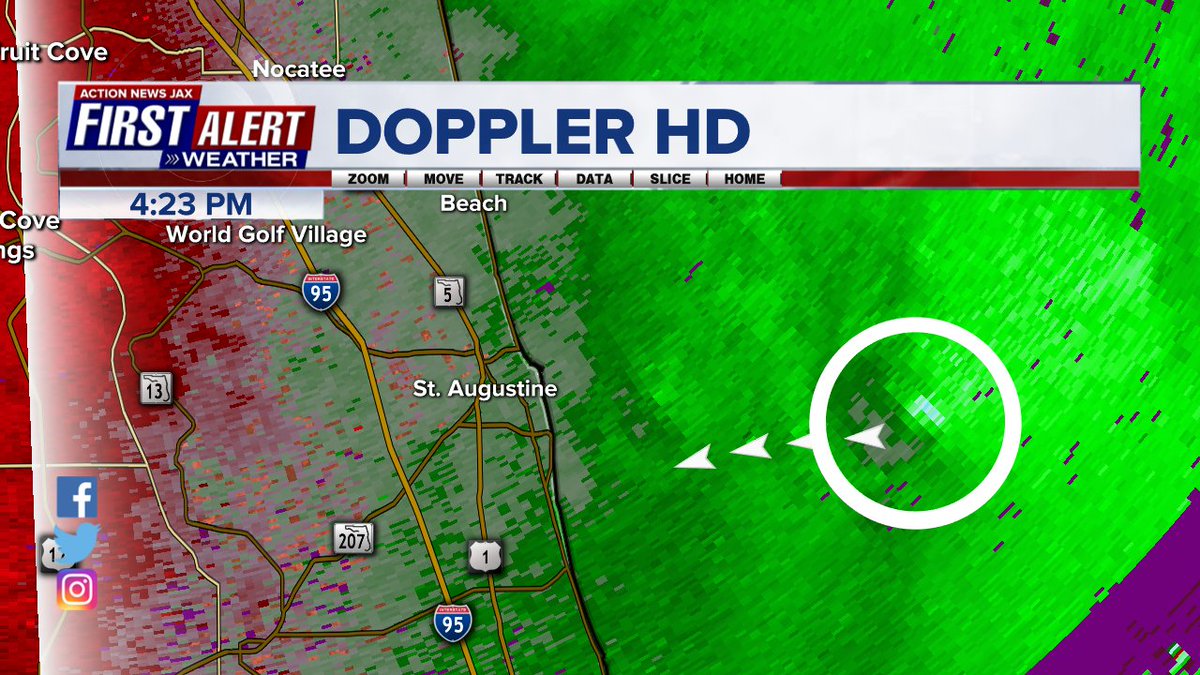

Many late nights in the First Alert Weather Center:

I tried to emphasize that no two hurricanes are alike & to not compare Irma with Matthew from last year. Two completely different beasts & Irma was going to be much more damaging inland vs. Matthew while the beaches would not suffer quite the beating though still significant. It became clear to me through the day Sunday that my listeners & viewers were consistently making the mistake of paying too much attention to the eye of the hurricane & not realizing how far from the center there would be strong winds & damage. Even more concerning... people did not understand the cone of uncertainty. All that cone represents is the average forecast error. So as the track became more certain, the cone became more narrow but had nothing to do with where there would be damage. So I decided - & on air said so - to take OFF the cone from the forecast graphic. It was a last minute desperate attempt to make people understand that Irma - even well to the west - would be a significant hit on NE Fl. & SE Ga.
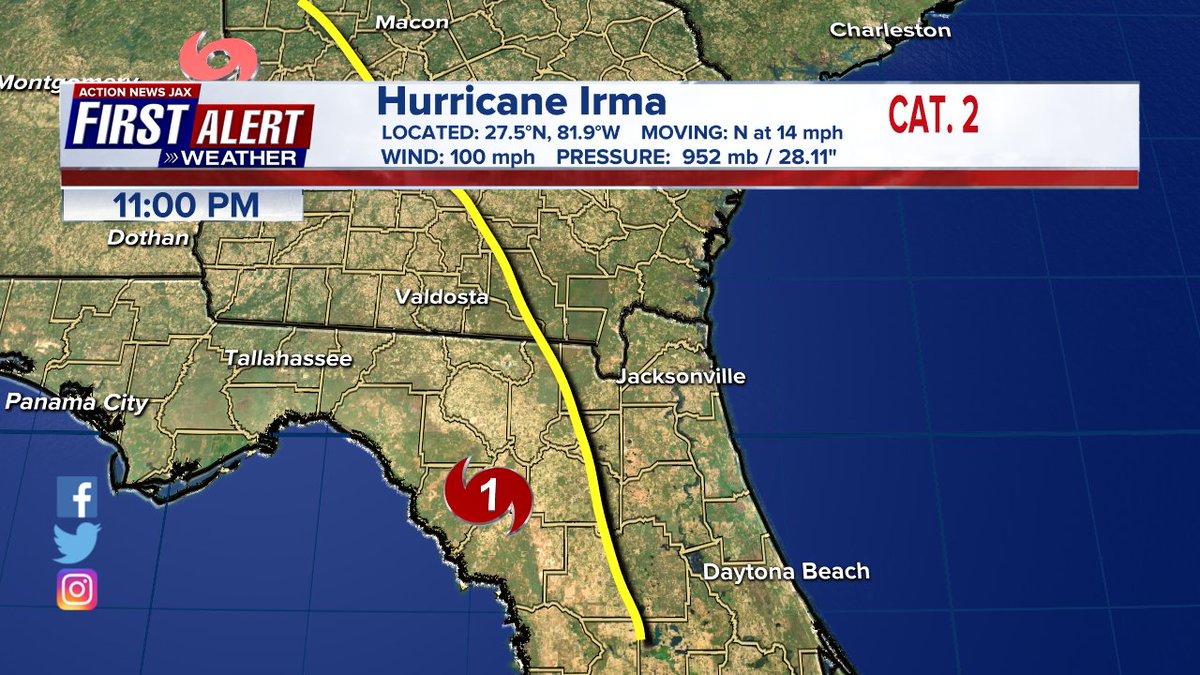
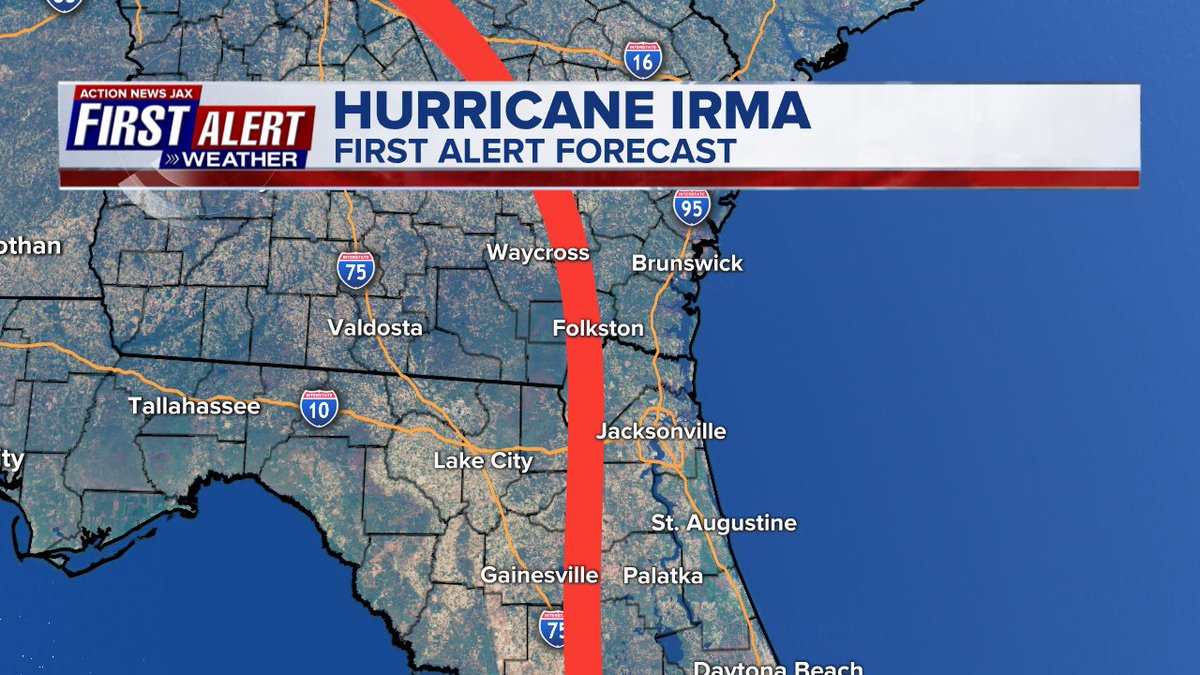
I also expected the track to the north up Florida to be closer to I-75. This worked out pretty well & resulted in higher winds overall. I tweeted my forecast track as you can see below. I was not trying to upstage the NHC but did want to make sure viewers understood the potential for the eye to be closer to NE Fl. Such a broad & large hurricane was going to have wide & serious impacts far from the center.
Sunday evening, Sept. 10th tweet just before 11pm:
Tweet Thu., Sept. 7th:
And I pulled out the typhoon teleconnection as a typhoon went into Eastern China after turning north/northwest. The upper level pattern over the Western Atlantic mirrored that of the W. Pacific leading to confidence in an upper level trough -- weakness/alleyway -- remaining over or near the U.S. east coast to which Irma would likely follow. Note the trough/rige/trough/ridge/trough sequence all the way from the W. Pacific to the W. Atlantic. The question & ultimate challenge was when which turned out to be off the north coast of Cuba.
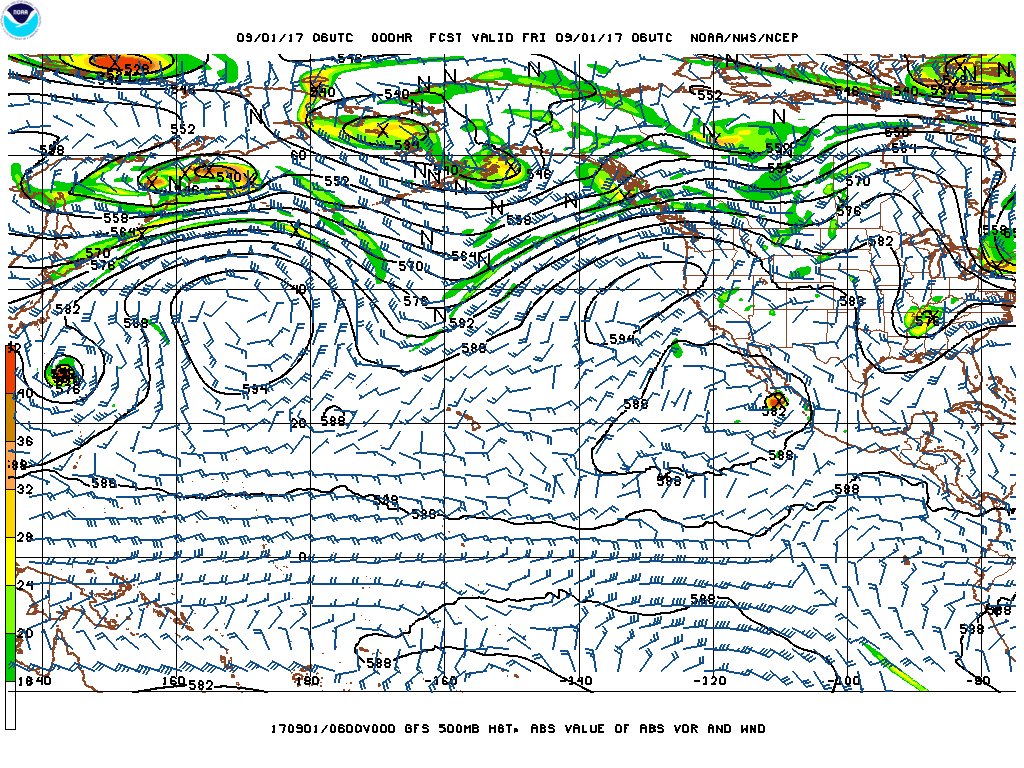
We tweeted this Sat. afternoon/evening, Sept. 9th:
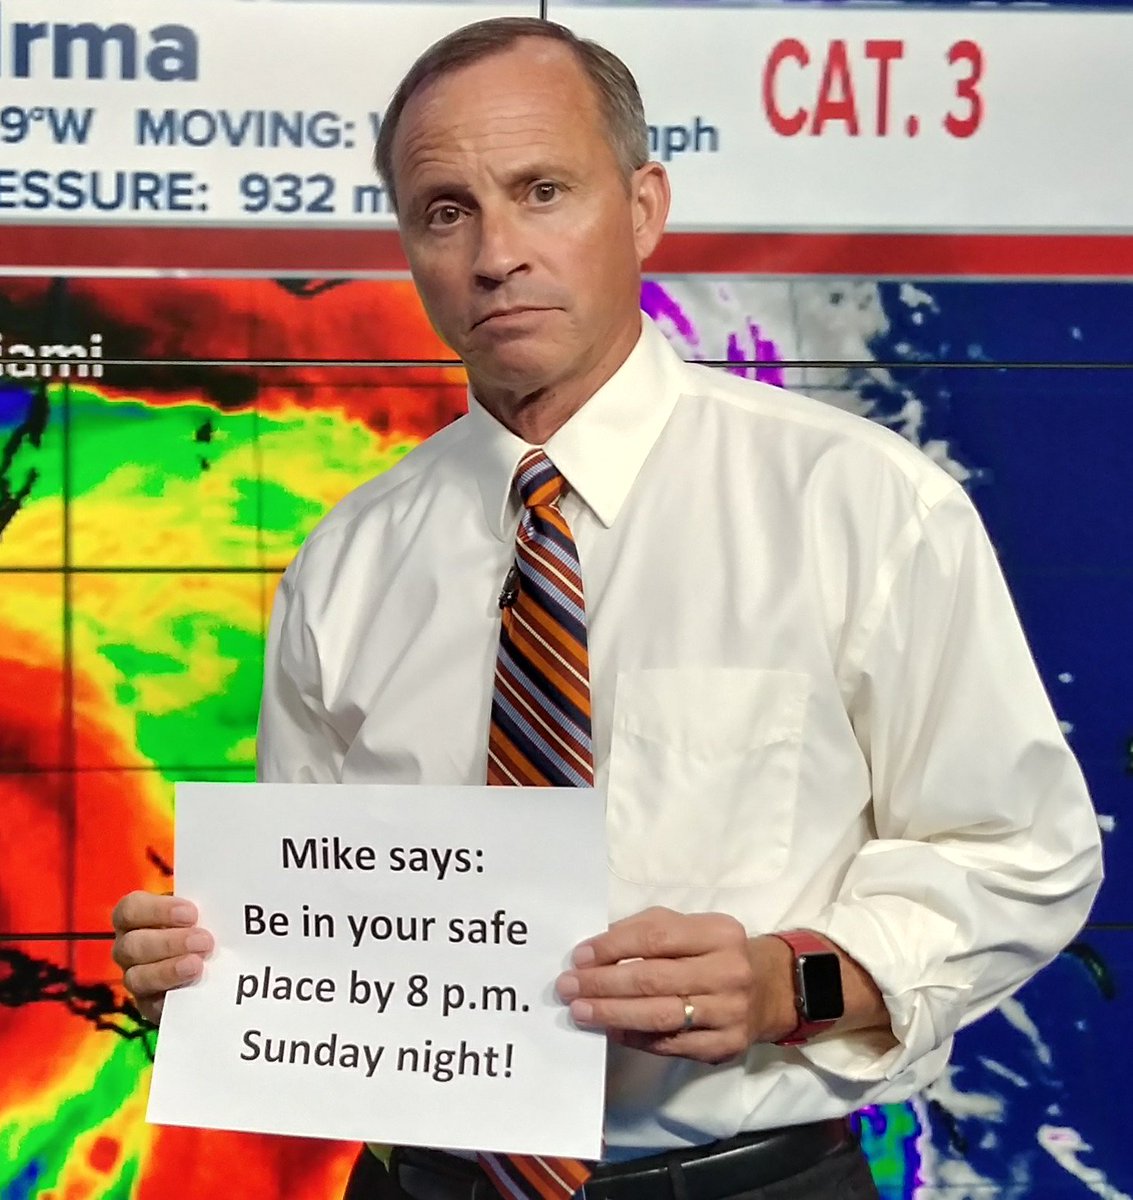
The NE Fl. Salvation Army sent us a "bushel basket" of goodies in the days leading up to Irma's hit....

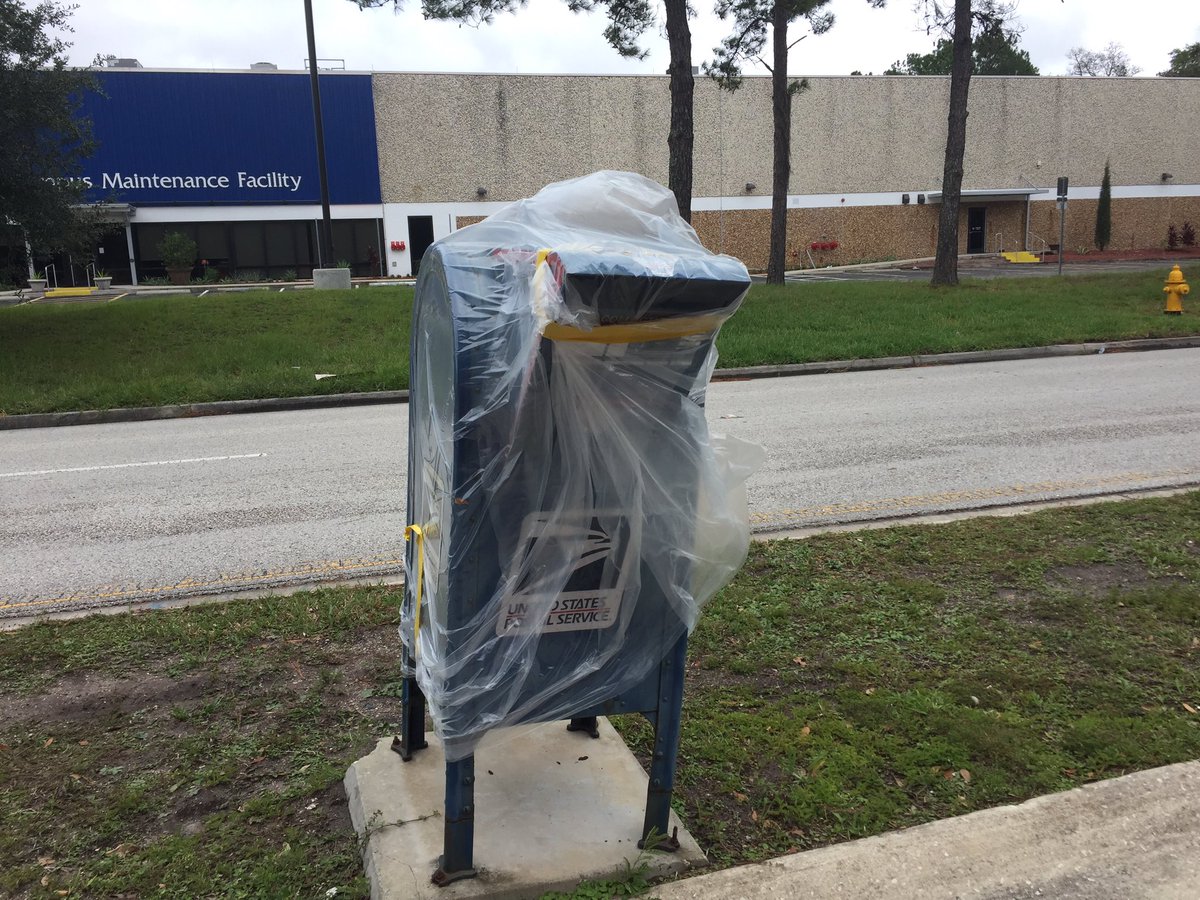
Neither rain, nor sleet, nor snow..... EXCEPT hurricanes.....
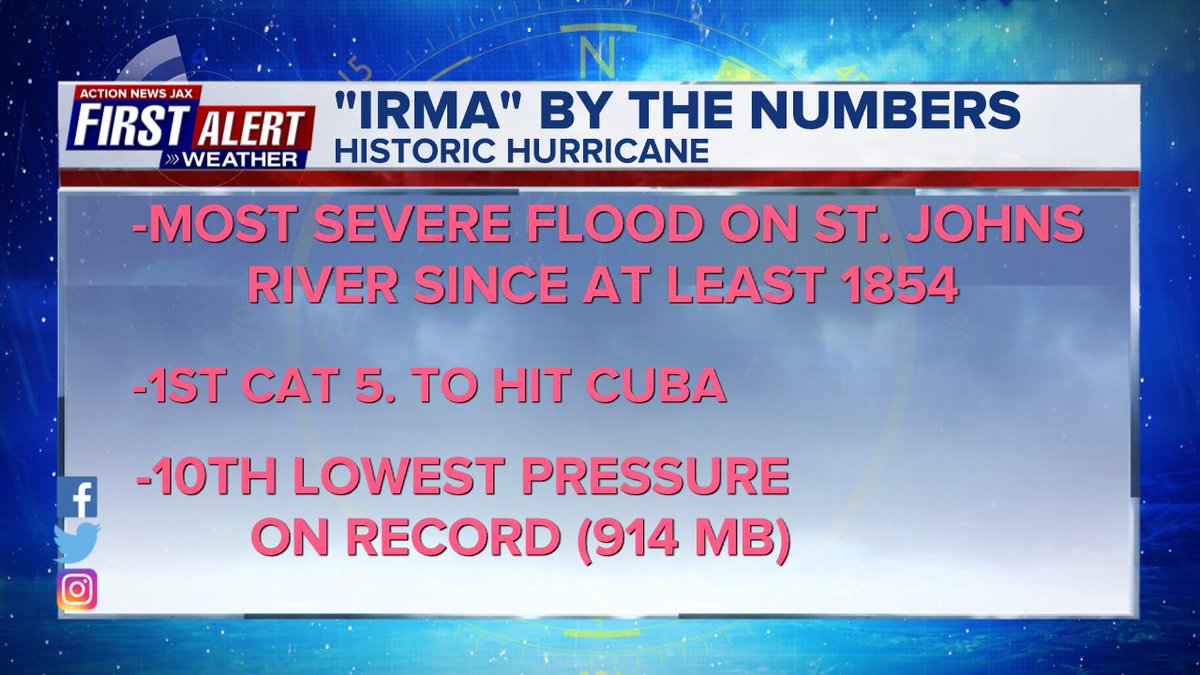
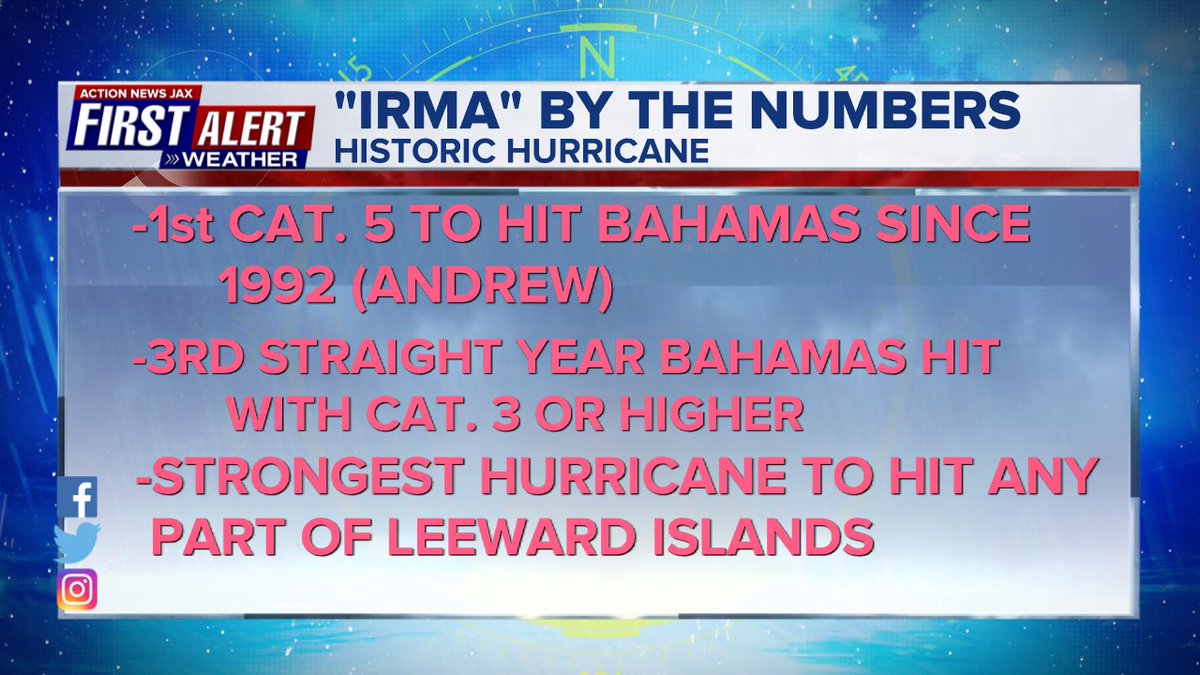
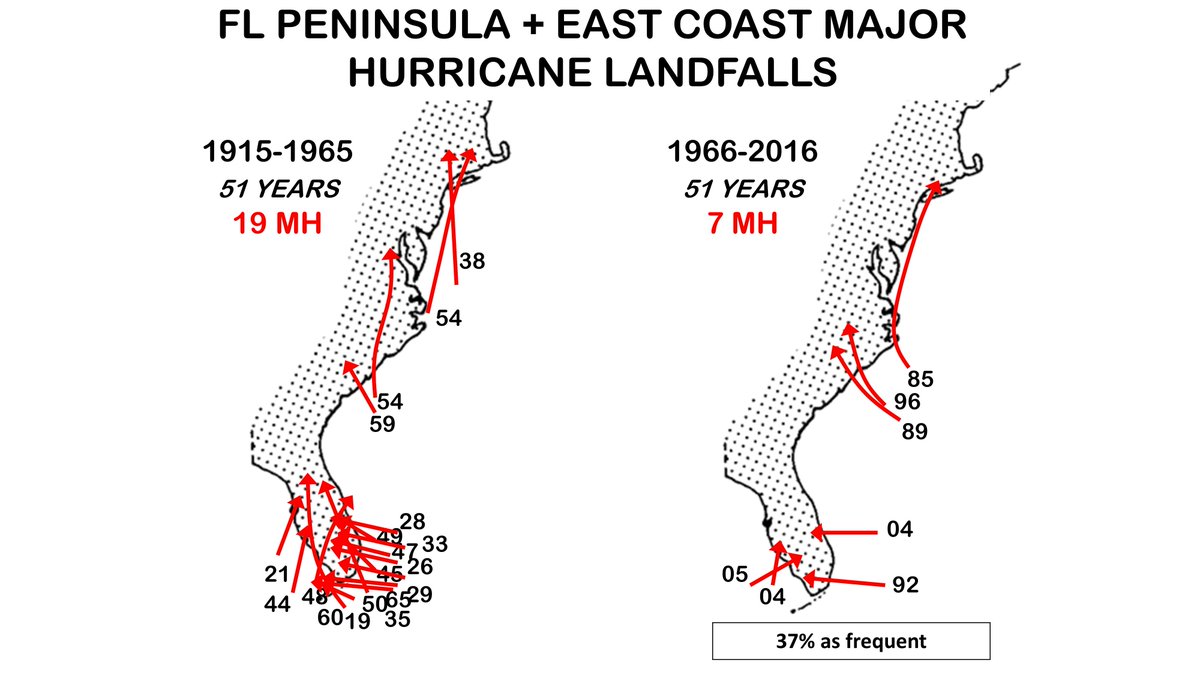
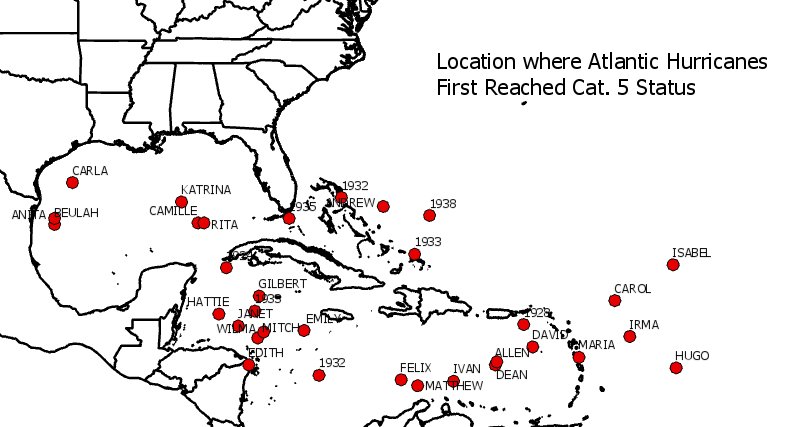
Two images courtesy Phil Klotzbach:
Click -- here -- for the Jacksonville N.W.S. Irma preliminary summary. Our Jax N.W.S. deserves high praise for their timely warnings.
Cox Media Group


